The decision in the data

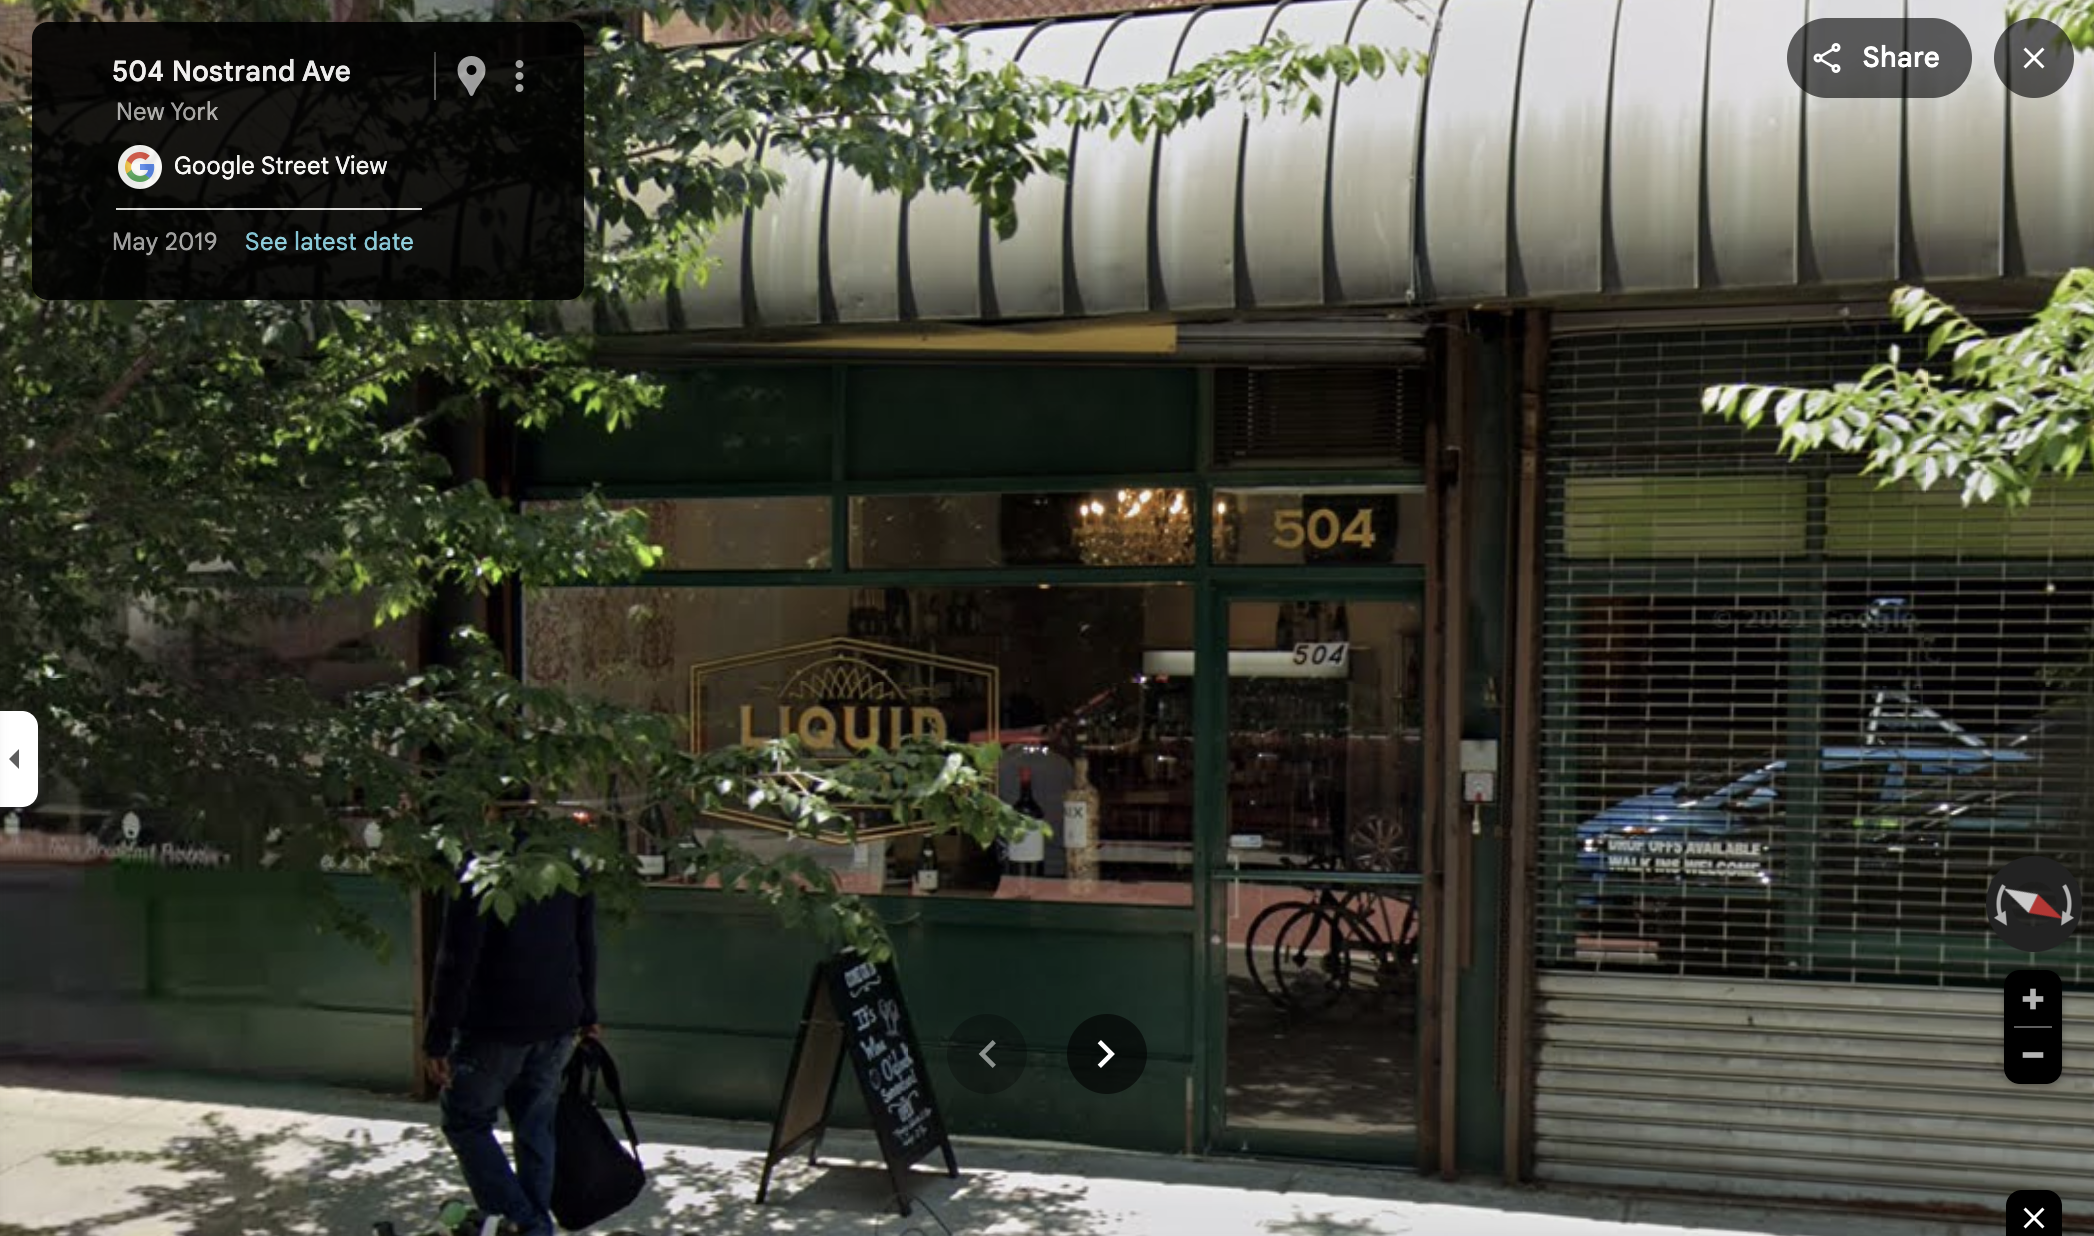
Same owner, same brand — three different disclosure decisions
Cloudy Donut Co. · Founded Baltimore, MD · Founders: Derrick Faulcon & Zewiditu Jewel · First Black-owned food & beverage business in Brooklyn Heights and Nolita
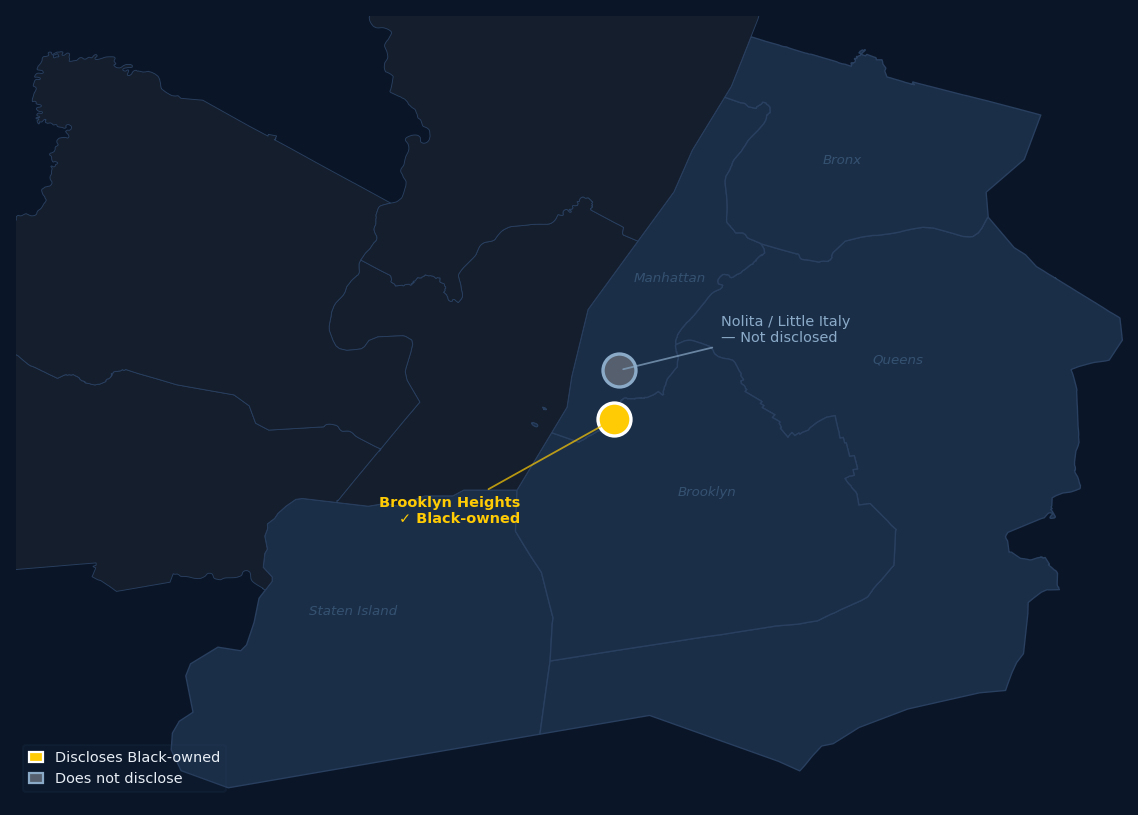
Brooklyn Heights, NY
14 Columbia Pl · 11201
Black-owned ✓Nolita / Little Italy, NY
209 Mott St · 10012
Not disclosed —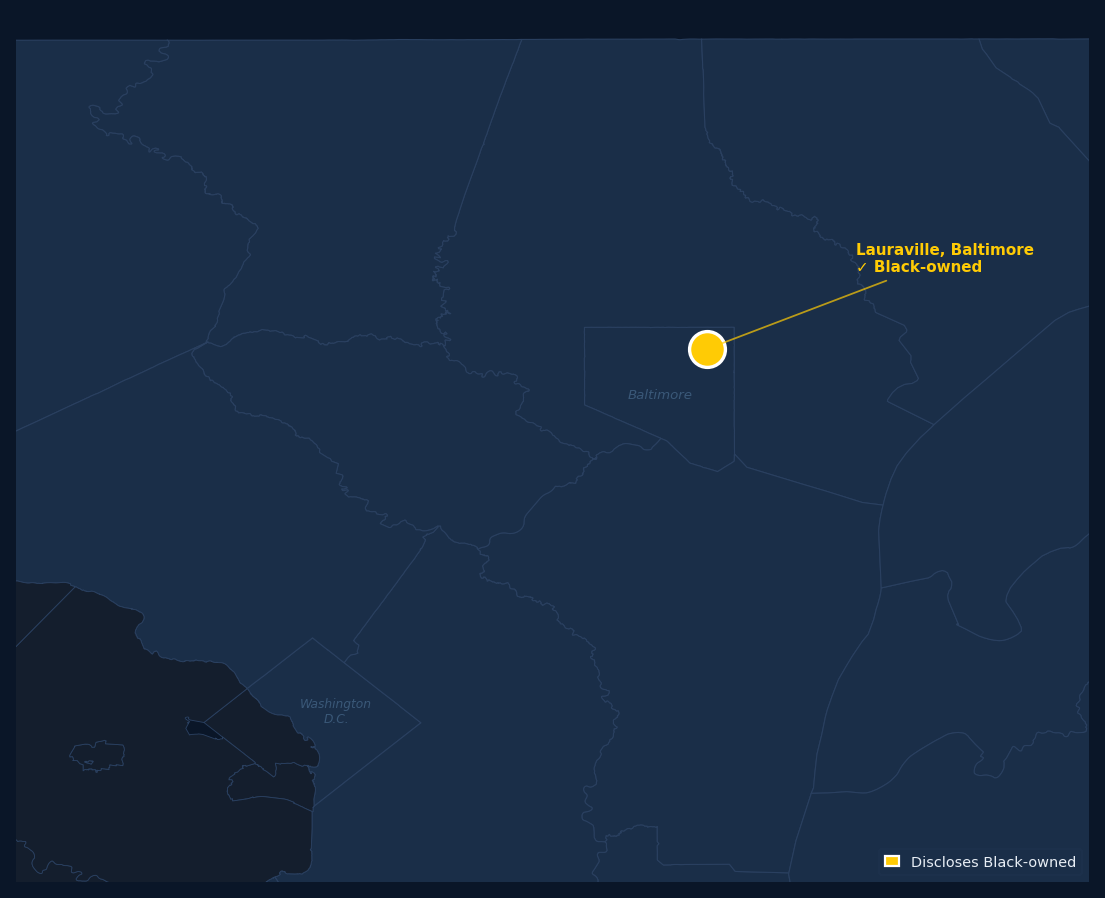
Lauraville, Baltimore, MD
4311 Harford Rd · 21214
Black-owned ✓Why would the same business owner make different decisions in different places?